

It’s every high schooler’s nightmare. You’ve taken the SAT, and, though you didn’t leave the test center feeling 100% confident, the test questions themselves seemed manageable—easier, even, than usual.
Then, two weeks later, you get your scores…and at first you think there must be some sort of mistake.
These can’t be your scores. They’re far lower than what you got on your last practice test, and, when you dig a little more into the score report, you see that you didn’t miss any more questions than usual. Maybe you even answered a few more questions right.
There’s been no mistake. These are your scores. You’re just yet another victim of the SAT’s erratic curve—the standardized testing world’s equivalent of a sudden tropical storm. Completely expected, yet also somehow unexpected and devastating.
Brutal SAT curves happen every year.
In the past, on occasions when the curve has seemed especially punishing or unfair, it’s led to internet outrage and petitions. Look no further than the international test from May 2019, when just a single missed question in each of the Reading and Writing sections translated to a 60-point drop in students’ Verbal scores. We’ll return to this example later.
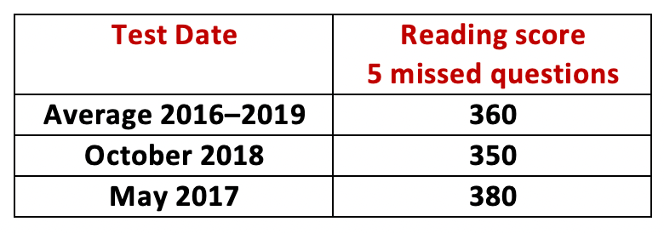
First, to understand what’s happening, let’s look at how the point value of just 5 questions can vary from one test to the next. (Note: since 2020, the College Board has not consistently released the full scales for its tests, so our most complete, representative picture comes from 2016–2019.) By looking at the average of the data, plus examples of particularly punishing and particularly lenient curves, we see a roughly 30-point variation in Reading scores between tests, with the average point value slightly closer to the lower value:
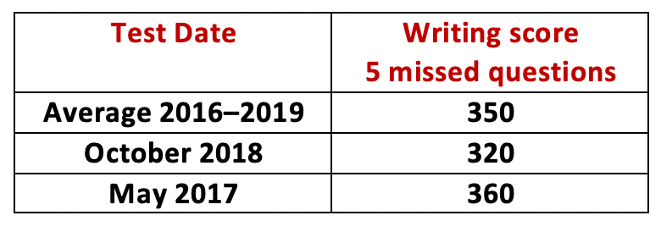
There’s a similar, 40-point variation in Writing, though the average is slightly closer to the higher value:
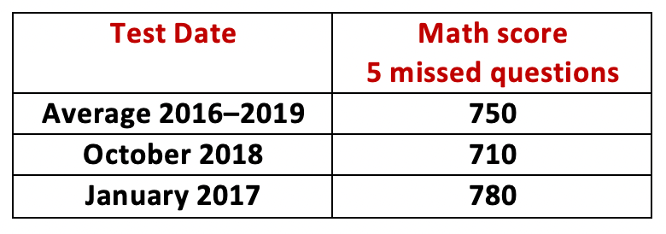
In Math, the range is much wider, with a 70-point difference between correctly answering 53 out of 58 questions on one test date versus another.
So we can clearly see the curve. But what is it? Why does it exist?
What is the SAT's curve?
Although the test’s design is patterned and predictable, the College Board does not reuse the same exact questions and passages every time, so test difficulty will naturally vary. To counteract this, and make certain that the scores from one test date are comparable to those from the next, the College Board shifts the scoring scale every time. So, on a particularly hard Math section like the one from January 2017, students might be tested on a few more esoteric concepts than is usual, but to offset that they can miss 2 questions and still score a “perfect” 800. On a test with questions that skew easier (for instance, March 2019 or October 2016), that same raw score would translate to a 770 or even lower.
It may not feel like it to test takers, but this shifting scale is intended to make testing fairer.
So, do certain test dates have reliably "easier" or "harder" curves than others?
Ask any superstitious high school junior, and they’ll tell you in a conspiratorial whisper that October is the hard test, since a large number of test takers are seniors on their third or fourth test attempts; or it’s March that’s super hard, because more students are taking it; or maybe that means March is easier, since more test takers means the average result gets balanced out?
Is there a pattern? The short answer: no.
There is no way for anyone, apart from the College Board, to predict the curve. That’s because the curve is actually set by the College Board’s predictions of student performance—it is not curved to how well students actually do on test day.
To make these predictions and set the test’s scale, the College Board pre-tests new questions internally, and it includes them on the SAT’s experimental section—the unscored 5th section that most students complete after the Math Calculator section.
But if this is all so rigorously pre-tested and thoughtfully designed, why, to a test-taker, does it still seem so cruel and random? Which is another way of asking, why does the worth of a single question vary to such an extreme?
Is there an explanation?
In May 2019, when international students were hit by that particularly crushing curve, they searched for explanations. Some developed the unsettling hypothesis that the SAT discriminated against non-U.S. students. Considering that international students could only take the test four times a year, this hypothesis felt like the College Board rubbing salt into a wound. Add to the mix all of the other rumors, and it’s understandable that the international college admissions community was angry.
At ArborBridge, our hypothesis is that in this case, and in similar situations before and since, domestic and international, there was no grand conspiracy. Instead, this is explainable by Hanlon’s Razor—“never attribute to malice that which is adequately explained by [poor data sampling].” We think the experimental section is to blame.
The SAT’s experimental section is an ungraded test section used to try out future questions and set testing curves in advance. Before the exam changed in 2016, every student used to take an experimental section at some point in their test. The hitch was that students never knew which section it was, so they tried just as hard on the experimental as they did on the rest of the test.
When the College Board rewrote the SAT in 2016, it separated the experimental section from the rest of the SAT and made it an add-on. They gave the experimental only to students who didn’t take the Essay section, and they clearly labeled for students which part of the test was experimental. Suddenly, fewer students took an experimental section, and students who got the section didn’t try as hard on it because they were certain it wouldn’t affect their scores.
In the past few years, the College Board has expanded the experimental section to additional test dates and more students, but many of these same underlying problems with methodology still exist. Essentially, the experimental section now garners worse data and is less predictive of student score ranges. Harsh and anomalous curves are the result of bad experimental data.
I've been the victim of an unfair curve. What can I do?
If you scored much lower than expected on the SAT, you may (understandably) be feeling discouraged. Here’s what you can do:
- Remember that you’re not alone. Whenever there’s a rough curve, it affects every student who took the same test.
- Take a break. If you’ve been studying intensely, give yourself time in the next month to relax and regain energy.
- Focus on what you can control. It’s easy to get on message boards and rail against the College Board, but it’s ultimately fruitless. Instead, put your energy toward future test dates and actions that can affect the rest of your college applications—like your schoolwork, extra-curriculars, and summer plans.
- Plan for future test dates. Think about whether you should plan to take that exam and if the test date after that works as a potential back-up. Consult a counselor or tutor for advice about when to start studying.
- Consider the ACT. Depending on your state or country of residence, you may have up to seven opportunities to take the ACT each year. This gives you more chances to take an official college admissions exam and shoot for your goal score. Because ACT scores are rounded averages of individual section scores, differences in test scales tend to have a less pronounced effect on student scores.
Need more individualized advice?
The recommendations above are general suggestions. If you have specific questions, reach out to our experts here. We’re happy to help in any way we can.
About ArborBridge
ArborBridge is the global leader in innovative, digital, one-on-one tutoring. With nearly a decade of experience teaching students online, ArborBridge supports students of all kinds: home schoolers, AP students, test preppers, and more. Our tutors specialize in creating personalized plans and in providing compassionate support for students and families.


